Leaking Kernel Memory with io_uring
In October 2025, I discovered a method to allocate kernel memory from userspace, allowing for the exceeding of a process's resource limits. This vulnerability opened the door to potential Denial of Service (DoS) attacks. In this post, I summarize my journey from the initial discovery of the bug to the submission of a patch to the Linux kernel.
Introduction to io_uring
Since the vulnerability exploits io_uring, a little introduction is necessary.
You can skip this section if you're familiar with it.
Released in 2019, io_uring is a modern Linux API for asynchronous
input/output. Unlike other syscalls, it uses
ring buffers as queues for
efficient communication between user and kernel space. But how does it work?
Basically, you add an entry to the submission queue (SQ), and then you read results from the completion queue (CQ). The kernel, on the other side, reads from the submission queue, performs the submitted work, and pushes the result to the completion queue.
In order for the kernel to read the submission queue, it must either be notified
(using the io_uring_enter syscall) or configured to poll it. The latter
enables a process to do I/O without making any syscalls, once the setup
phase is done.


This is why I/O heavy programs
makes far fewer system calls
and tend to perform better with io_uring.
That being said, io_uring was released in 2019 and is not as battle-tested as
other Linux system calls. In June 2023, Google's security team reported that 60%
of the exploits submitted to their bug bounty program in 2022 were exploits of
io_uring vulnerabilities. This is why it is disabled in Android, ChromeOS, as
well as Google servers.
And they are right to do so, as we will see.
Discovery of the Bug
For context, I discovered the bug while developing my
toy event loop library. I build stuff to
learn things. I believe that's the best way to have a real understanding of how
things work. So, naturally, I chose to build an event loop library to understand
how io_uring works.
This led me to create an API around io_uring, and thus question its design.
As we've seen previously, io_uring uses ring buffers as a fixed size queue to
communicate.
When working with queues, you must consider what will happen if the consumer is slower than the producer. In that case, we must ask ourselves:
- What happens if a process keeps adding entries to the submission queue faster than the kernel reads them?
- What happens if the kernel produces completions faster than the program consumes them?
Let's answer those questions.
What happens if a process keep adding entries to the submission queue faster than the kernel reads them?
Short answer is you can't. If the submission queue is full, you won't be able to get an entry.
The producer must submit entries or wait for the kernel to poll entries (if configured to do so) to submit more work.
This is clearly documented in the man pages.
The producer can't be faster than the consumer.
What happens if the kernel produces completions faster than the program consumes them?
This is the interesting case. I couldn't find the answers in the
man pages, so I built
small C program named kmemleak to test
it.
Here is the relevant part:
/**
 * Submits given number of no-op operation and never read the completion queue.
 */
int submit_loop(struct io_uring *ring, long entries) {
  struct io_uring_sqe *sqe;
  int submitted;

  // Submit tasks in loop.
  for (;;) {
    // Retrieve a submission queue entry (SQE).
    sqe = io_uring_get_sqe(ring);

    // Failed to retrieve SQE, the SQ is full.
    if (sqe == NULL || entries <= 0) {
      // Submit all SQE.
      submitted = io_uring_submit(ring);

      // We're done.
      if (submitted >= entries || entries <= 0)
        break;

      // Update number of entries to submit.
      entries -= submitted;

      continue;
    }

    // Prepare a no-op operation that will completes immediately.
    io_uring_prep_nop(sqe);

    // We never read completions to fill CQ.
    // At some point, CQ will be full.
  }

  return 0;
}
NOTE: ring buffers are configured to hold at most 4096 entries.
Basically, that program adds a fixed number of no-op entries to the SQ, submitting work if needed, and then sleep indefinitely (in the main function).
It never consumes the result of the operations, so kernel memory should never be released. We're leaking kernel memory voluntarily.
If you run the program to submit 1,000,000,000 entries and observe memory usage
in htop, you will see that total memory usage increases (the Mem[||||] bar
in the top section) while process memory usage stays at 0.0%.
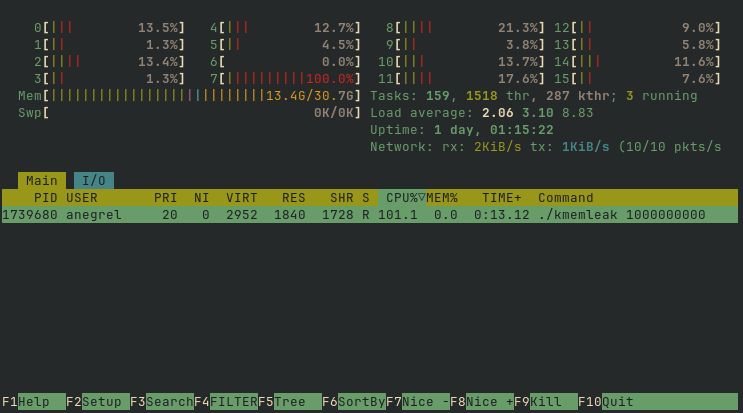
Once the
Scolumn value (next to%CPU) isS, the process is done leaking memory and sleeps forever. You can kill it.
Is process not account for kernel memory it allocates? Are htop metrics
erroneous?
As we will see, the issue is more subtle.
Validation of the Issue
To confirm the hypothesis, it is possible run kmemleak in a memory
constrained container and try to go above the limit.
Container runtimes use control groups to constrain resource usage of containers. Let's do the same.
Since version 211, systemd-run can spawn processes in control groups. One can
run kmemleak and limit memory usage to 10MiB:
$ systemd-run --scope --user -p MemoryMax=10M ./kmemleak 10000000
Again, observing global memory usage will show that it increases way past the
10MiB limit. Trying the same using
memleak, a program
that allocates user space memory, leads to the process getting instantly killed
as soon as it tries to exceed the memory limit.
We're now 100% sure there is a problem here. Still, we don't know what's happening.
Reporting the Bug
Before spending more time on this, it is wise to check if someone already reported this bug, and maybe fixed it.
A brief search led me to this issue in the
liburing repository:
io_uring can use unlimited memory, DoS the system: no backpressure
on non-completing operations #293
NOTE:
liburingis a C library by the author ofio_uring, to useio_uring.
It's marked as resolved with the following conclusion:
it's now restricted by a memory cgroup
https://git.kernel.dk/cgit/linux-block/commit/?h=for-5.14/io_uring&id=91f245d5d5de0802428a478802ec051f7de2f5d6
I'm using a kernel more recent that this issue, this is either a regression or a different use case.
Indeed, as we've seen, the memory is accounted for. Nevertheless, my kernel is more recent than this issue; it's a different bug.
There is nothing on Bugzilla. I successfully reproduced the issue using the latest kernel, so I decided to submit a bug myself.
After 2 months, the issue was still open. I decided to track that motherfucking bug myself 🦟.
Tracking the Bug
To continue our investigation, we can check memory usage reported by the memory
controller of the control group. According to
cgroup-v2 documentation,
the memory.peak value corresponds to:
The max memory usage (in bytes) recorded for the cgroup and its descendants since the creation of the cgroup.
Metrics are exposed as files on the cgroup2 filesystem, which is usually
mounted on /sys/fs/cgroup/:
$ PID="$(ps a -o pid,command | awk ' /kmemleak/ { print $1; exit }')"
$ cat "/sys/fs/cgroup/$(cat /proc/$PID/cgroup | awk -v FS=: '{ print $3 }')/memory.peak"
401702912
This is 383MiB of memory, way beyond the 10MiB limit. Kernel memory is tracked and accounted for, but the process isn't killed for an unknown reason.
Reading the memory.event file shows that the memory controller detected the
exceeding memory usage; still, no OOM kill happened.
$ cat "/sys/fs/cgroup/$(cat /proc/$PID/cgroup | awk -v FS=: '{ print $3 }')/memory.events"
low 0
high 0
max 95512
oom 0
oom_kill 0
oom_group_kill 0
The documentation is clear: the control group should be in OOM state.
max: The number of times the cgroup’s memory usage was about to go over the max boundary. If direct reclaim fails to bring it down, the cgroup goes to OOM state.
So, why isn't the process killed? When is the OOM killer triggered?
From kernel.org:
It is possible that on a loaded machine memory will be exhausted and the kernel will be unable to reclaim enough memory to continue to operate. In order to save the rest of the system, it invokes the OOM killer.
It doesn't help much, at this point, we have no choice but read kernel code...
But where do we start? The kernel is literally millions of lines of code,
the memory subsystem is more than 100 thousand lines of code, and io_uringis
around 20 thousand lines of code. Reading all that codes will take weeks at the
very least.
We have to narrow down our search. We must trace the kernel.
Tracing the Kernel
The Linux kernel comes with various tracing mechanisms that can be used for debugging.
One of them is Kernel Probes or Kprobes that enables you to dynamically break into any kernel routine and collect debugging and performance information non-disruptively.
Kprobes requires building and loading a kernel module that will register a group of probes. It looks like a lot of work for something that will be thrown in the trash as soon as we're done. If only there was an easy way to trace the kernel without building a kernel module...
>
eBPFenters the chat.
Extended Berkeley Packet Filter or eBPF is Linux technology that can run
sandboxed programs within the kernel itself. It is used to safely and
efficiently extend the capabilities of the kernel without requiring to change
kernel source code or load kernel modules.
However, to use eBPF you must write a program, compile it to eBPF bytecode
and loads it into the kernel. If only there was an easy way to create and load
an eBPF program...
>
bpftraceenters the chat.
bpftrace is a high-level tracing language for Linux that provides a quick
and easy way to write eBPF programs. It is exactly what we need.
bpftrace takes inspiration from awk and is ideal for short, single use
programs.
Listing Kprobes to find the one produces. We can list available Kprobes:
$ sudo bpftrace -l 'kprobe:*' | wc -l
79187
Hmm, that's a lot. Maybe we can list probes with the infix mem:
$ sudo bpftrace -l 'kprobe:*mem*' | wc -l
1523
That's better. After a quick skim, it seems we are only interested in probes
with the memcg infix. memcg stands for memory control group.
$ sudo bpftrace -l 'kprobe:*memcg*' | wc -l
59
Perfect! Let's trace all those kernel probes and count their invocations.
# Run this command while running kmemleak in a control group.
$ sudo bpftrace \
    -e 'kprobe:*memcg* { printf("%s\n", probe); }'\
    -p $PID \
  | sort | uniq -c
      35 kprobe:flush_memcg_stats_dwork
     163 kprobe:__get_obj_cgroup_from_memcg
     186 kprobe:memcg_charge_kernel_stack
    1033 kprobe:memcg_page_state
    1450 kprobe:__memcg_kmem_uncharge_page
    3006 kprobe:memcg_list_lru_alloc
    4248 kprobe:__memcg_kmem_charge_page
   38475 kprobe:count_memcg_events
  104512 kprobe:charge_memcg
  135263 kprobe:mod_memcg_state
  154792 kprobe:try_charge_memcg
  531742 kprobe:mod_memcg_lruvec_state
 6028668 kprobe:__memcg_slab_post_alloc_hook
25649294 kprobe:__memcg_slab_free_hook
Only these 14 probes are triggered by kmemleak. Nothing conclusive here; let's
print the kernel stack trace:
$ sudo bpftrace -e 'kprobe:*memcg* { printf("%s\n", kstack()); }' -p $PID
        __memcg_slab_post_alloc_hook+5
        __kmalloc_noprof+1153
        io_alloc_ocqe+111
        __io_submit_flush_completions.cold+61
        io_submit_sqes+555
        __do_sys_io_uring_enter+597
        do_syscall_64+183
        entry_SYSCALL_64_after_hwframe+119
...
Much better! We can see all functions called from the io_uring_enter system
call up to an allocation of kernel memory: kmalloc.
It appears that an o?????????? completion queue entry (OCQE) is allocated by
io_alloc_ocqe. The manual discusses CQE, but there is no mention of OCQE.
At this point, I feel like we have sufficiently narrowed our search. It's time to read kernel code 😃.
$ git clone https://github.com/torvalds/linux
$ git checkout v6.16 # my kernel version
$ grep -Rn 'io_alloc_ocqe' io_uring/
io_uring.c:747:static struct io_overflow_cqe *io_alloc_ocqe(struct io_ring_ctx *ctx,
io_uring.c:888:	ocqe = io_alloc_ocqe(ctx, cqe, big_cqe, GFP_KERNEL);
io_uring.c:900:	ocqe = io_alloc_ocqe(ctx, cqe, big_cqe, GFP_ATOMIC);
💡 Oooh! An overflow completion queue entry (OCQE) is allocated each time an operation completes and the CQ is full.
By looking at the bpftrace output for our process, all kernel allocations are
done by io_alloc_ocqe. However, we don't know which call, the one with
GFP_KERNEL or GFP_ATOMIC, is allocating the memory.
At this point, I'm confident the bug is not far away. Sooner or later, compiling
and running a patched kernel will be needed. We might as well do it now and use
the printf / printk jutsu to know whether GFP_KERNEL or GFP_ATOMIC is
the culprit.
Compiling the Kernel
Compiling the kernel is surprisingly simple:
# Clone the kernel.
$ git clone --depth=1 -b v6.16 https://git.kernel.org/pub/scm/linux/kernel/git/stable/linux.git

# Enter the repository.
$ cd linux/

# Generate default config.
$ make defconfig

# Edit config using TUI.
# Be sure to enable `io_uring`, and control groups v2 with
# memory controller which are not the default!
$ make menuconfig

# Edit io_uring/io_uring.c and
# add `printk(KERN_INFO "OVERFLOW CQE: GFP_KERNEL\n");`
# and `printk(KERN_INFO "OVERFLOW CQE: GFP_ATOMIC\n");`
# next to `io_alloc_ocqe` function calls.

# Compile the kernel.
$ make -j$(nproc)
That's it, the compiled kernel image is located at arch/*/boot/bzImage.
Booting the Kernel in a VM
This part is less straightforward. First, you must have a working QEMU virtual
machine with Linux installed. I chose to use Debian official 64bit qcow2
image.
host $ curl -Lo debian.qcow2 "https://cloud.debian.org/images/cloud/trixie/latest/debian-13-nocloud-amd64.qcow2"
host $ qemu-system-x86_64 -drive file=./debian.qcow2 -m 4G -smp 2 --enable-kvm
Then you can override the kernel in the boot partition:
# Copy compiled kernel image in the VM.
vm $ scp $host:/path/to/bzImage /boot/vmlinuz-*

# Reboot.
vm $ reboot
That's it, you're running a custom kernel:
vm $ uname -a
Linux localhost 6.16.0-dirty #1 SMP PREEMPT_DYNAMIC Fri Feb  6 12:59:47 CET 2026 x86_64 GNU/Linux
Yay! The kernel just compiled is running in the VM.
Finally, it can be determined which of GFP_KERNEL and GFP_ATOMIC is called:
vm $ systemd-run --user --scope -p MemoryMax=10M ./kmemleak 10000000
[  422.646799] OVERFLOW CQE: GFP_ATOMIC
[  422.653700] OVERFLOW CQE: GFP_ATOMIC
[  422.654609] OVERFLOW CQE: GFP_ATOMIC
[  422.655624] OVERFLOW CQE: GFP_ATOMIC
[  422.656601] OVERFLOW CQE: GFP_ATOMIC
[  422.657460] OVERFLOW CQE: GFP_ATOMIC
[  422.663864] OVERFLOW CQE: GFP_ATOMIC
[  422.669921] OVERFLOW CQE: GFP_ATOMIC
[  422.670847] OVERFLOW CQE: GFP_ATOMIC
[  422.671800] OVERFLOW CQE: GFP_ATOMIC
[  422.672683] OVERFLOW CQE: GFP_ATOMIC
...
Now we know. But what are these GFP things?
Kernel Memory Allocation
Memory allocation in the kernel is well documented. GFP acronym stands for "get free pages", the underlying memory allocation function. GFP flags exist to express how some memory should be allocated.
For example, kzalloc, a function to allocate zeroed memory, is defined as
follows:
static inline void *kzalloc(size_t size, gfp_t gfp)
{
        return kmalloc(size, gfp | __GFP_ZERO);
}
It simply sets the
__GFP_ZERO bit flag.
Common sets of GFP flags are defined as GFP_XXX values while bit flags are
defined as __GFP_XXX:
GFP_KERNEL, a general-purpose flag used for kernel-internal allocations, is defined as:__GFP_RECLAIM | __GFP_IO | __GFP_FS.GFP_ATOMIC, a flag used for allocations that cannot sleep and need to succeed, is defined as__GFP_HIGH | __GFP_KSWAPD_RECLAIM
Allocations that should be accounted for by the memory controller must have the
__GFP_ACCOUNT bit set. This bit flag is set within the function itself:
static struct io_overflow_cqe *io_alloc_ocqe(struct io_ring_ctx *ctx,
					     struct io_cqe *cqe,
					     struct io_big_cqe *big_cqe, gfp_t gfp)
{
    // ...
	ocqe = kzalloc(ocq_size, gfp | __GFP_ACCOUNT);
    // ...
}
So, why isn't the process killed? When is the OOM killer triggered?
From kernel.org:
It is possible that on a loaded machine, memory will be exhausted and the kernel will be unable to reclaim enough memory to continue to operate. In order to save the rest of the system, it invokes the OOM killer.
It seems to be event-based. When the kernel needs more memory and can't reclaim it, it invokes the OOM killer.
The kernel knows more memory is needed when kmalloc is called. Memory
allocations may trigger direct or background reclaim depending on provided GFP
flags:
__GFP_DIRECT_RECLAIM: indicates that the caller may enter direct reclaim.__GFP_KSWAPD_RECLAIM: indicates that the caller wants to wake kswapd when the low watermark is reached and have it reclaim pages until the high watermark is reached.
Looking at stack traces of other Kprobes, notably try_charge_memcg, confirm
it.
try_charge_memcg+1
obj_cgroup_charge_account+209
__memcg_slab_post_alloc_hook+259
__kmalloc_noprof+1153
io_alloc_ocqe+111
__io_submit_flush_completions.cold+61
io_submit_sqes+555
__do_sys_io_uring_enter+597
do_syscall_64+183
entry_SYSCALL_64_after_hwframe+119
After allocating memory, obj_cgroup_charge_account is called to update the
control group's statistics and trigger the OOM killer if needed.
Memory allocations may trigger direct or background reclaim, and it is useful to understand how hard the page allocator will try to satisfy that or another request.
try_charge_memcg is pretty complex; it is 194 lines long. I won't go into the
details as I don't understand everything, but you can read it
here
if you're curious.
Skimming through clearly shows that it can trigger the OOM killer. There is also the following comment, which, to my surprise, states that memory limit can be exceeded:
/*
 * The allocation either can't fail or will lead to more memory
 * being freed very soon.  Allow memory usage go over the limit
 * temporarily by force charging it.
 */
page_counter_charge(&memcg->memory, nr_pages);
if (do_memsw_account())
	page_counter_charge(&memcg->memsw, nr_pages);
What's the point of a limit if it can be exceeded?
At that time, this was my first time reading kernel code for real. I used to idealize Linux code as perfectly written, but the reality is Linux is like all pieces of software: a best-effort product. Despite everything, there are questionable technical choices, technical debt, and bugs.
Memory allocation makes no exception. When you dive deep into systems, you find weird behavior in corner cases.
Adding printk call there shows that this section is never executed.
At this point, it is unsure whether the bug lies in io_uring or
try_charge_memcg, but we can try to fix the bug.
Bug Fix
Let's work smartly. It is highly probable that this is an io_uring bug, memory
management subsystem and control groups has been battle-tested for years,
running on thousands of hardware, and is widely used in the industry (Docker,
Podman, Kubernetes). Moreover, there is way less code in io_uring so it will
be faster to grasp.
The first change to try is to replace GFP_ATOMIC with GFP_KERNEL to see if
both calls buggy.
/* io_uring/io_uring.c */
static __cold bool io_cqe_overflow_locked(struct io_ring_ctx *ctx,
 {
        struct io_overflow_cqe *ocqe;

-       ocqe = io_alloc_ocqe(ctx, cqe, big_cqe, GFP_ATOMIC);
+       ocqe = io_alloc_ocqe(ctx, cqe, big_cqe, GFP_KERNEL);
        return io_cqring_add_overflow(ctx, ocqe);
 }
Recompile, and update the kernel, reboot, and run kmemleak:
vm $ systemd-run --user --scope -p MemoryMax=1M ./kmemleak 10000000
Running as unit: run-p336-i337.scope; invocation ID: 01499273178743eb881fcdf222a1c386
[   67.536954] kmemleak invoked oom-killer: gfp_mask=0x2dc0(GFP_KERNEL|__GFP_ZERO|__GFP_NOWARN), order=0, oom_score_adj=0
[   67.540643] CPU: 1 UID: 0 PID: 336 Comm: kmemleak Not tainted 6.16.0-dirty #8 PREEMPT(voluntary)
[   67.540647] Hardware name: QEMU Standard PC (i440FX + PIIX, 1996), BIOS rel-1.17.0-0-gb52ca86e094d-prebuilt.qemu.org 04/01/2014
[   67.540649] Call Trace:
[   67.540661]  <TASK>
[   67.540662]  dump_stack_lvl+0x4d/0x80
[   67.540672]  dump_header+0x3f/0x19e
[   67.540675]  oom_kill_process.cold+0x8/0x7c
[   67.540677]  out_of_memory+0x204/0x530
[   67.540682]  mem_cgroup_out_of_memory+0xc5/0xd0
[   67.540686]  try_charge_memcg+0x3d8/0x5f0
[   67.540689]  obj_cgroup_charge_account+0xf3/0x430
[   67.540691]  __memcg_slab_post_alloc_hook+0x100/0x350
[   67.540693]  kmem_cache_alloc_bulk_noprof+0x45c/0x4f0
[   67.540697]  __io_alloc_req_refill+0x3f/0xd0
[   67.540700]  io_submit_sqes.cold+0x8/0x190
[   67.540703]  ? __io_uring_add_tctx_node+0x41/0x140
[   67.540725]  __do_sys_io_uring_enter+0x255/0x7b0
[   67.540732]  ? hrtimer_interrupt+0x120/0x240
[   67.540736]  do_syscall_64+0xa4/0x2a0
[   67.540741]  entry_SYSCALL_64_after_hwframe+0x77/0x7f
It works! However, this isn't the fix; there is a reason different flags are passed.
GFP_KERNEL and GFP_ATOMIC are used in io_cqe_overflow and
io_cqe_overflow_locked respectively. The latter is called while holding a
lock / mutex over the
completion queue. This lock is a
spinlock. Basically, it spin / loop
until it succeed to acquire the lock.
When working with mutexes, it is a good practice to keep the lock on for as
little time as possible to reduce contention. This is why GFP_ATOMIC is used,
unlike GFP_KERNEL it
never sleeps.
I tried different solutions to work
around that problem. I tried to remove the lock to use GFP_KERNEL, I tried to
allocate memory with GFP_KERNEL before obtaining the lock, and I tried to
charge memory after releasing the lock.
After consulting Jens Axboe, creator
and maintainer of io_uring, it seems that all my solutions are broken in a
different way. He suggested to try using GFP_NOWAIT flag instead and see if
that fixes it.
So, that's what I did. It fixed the issue but in a way different that I had envisioned...
See, I've been so focused on making the process killed when it exceeds memory limits that I didn't look for another way. Allocations could simply fail and returns a null pointer. Overflow completion queue entry would be silently dropped on the floor and that's it.
That's what is happening with GFP_NOWAIT.
At first I didn't like this solution, and you may feel the same, because it means a process may never see the result of an I/O operation. But as I said previously all software are best-effort, nothing is perfect, especially in extreme circumstances such as out of memory. In any case, the process will be killed on next allocation.
So what's the difference between GFP_NOWAIT and GFP_ATOMIC?
#define GFP_ATOMIC (__GFP_KSWAPD_RECLAIM | __GFP_HIGH)
#define GFP_NOWAIT (__GFP_KSWAPD_RECLAIM | __GFP_NOWARN)
__GFP_NOWARN disables warning logs when an allocation fails. It has no impact
on the allocation itself.
__GFP_HIGH marks the allocation as high priority and may use emergency
pools. This specific bit enables the allocation to succeed and exceed the limit.
You can try the fix yourself by replacing GFP_ATOMIC with GFP_NOWAIT or
GFP_ATOMIC & ~__GFP_NOWARN to see the warnings.
Recompiling the kernel and running kmemleak along with htop shows that total
memory usage doesn't increase anymore 🥳.
Final Words
To conclude, the real issue was that it was possible to trigger GFP_ATOMIC
kernel allocations from userspace. All allocation with the __GFP_HIGH bit set
can exceed memory limit temporarily. If the only allocation triggered by a
syscall has this bit set, one can exploit it.
While debugging the kernel, I added a printf in kmemleak to monitor the
progress of submissions. Suddenly, the problem vanished. After wasting several
minutes, I realized that the printf caused a minor segfault, which led to
memory accounting being triggered, ultimately activating the OOM killer.
I submitted the patch, and I am pleased to share that it has been accepted upstream. This was my first time diving into Linux kernel code and it's been an enriching experience.
Here's the final patch, part of the Linux 6.19. It's not much but its honest work! 🥹
---
 io_uring/io_uring.c | 2 +-
 1 file changed, 1 insertion(+), 1 deletion(-)

diff --git a/io_uring/io_uring.c b/io_uring/io_uring.c
index 6cb24cdf8e68..709943fedaf4 100644
--- a/io_uring/io_uring.c
+++ b/io_uring/io_uring.c
@@ -864,7 +864,7 @@ static __cold bool io_cqe_overflow_locked(struct io_ring_ctx *ctx,
 {
 	struct io_overflow_cqe *ocqe;

-	ocqe = io_alloc_ocqe(ctx, cqe, big_cqe, GFP_ATOMIC);
+	ocqe = io_alloc_ocqe(ctx, cqe, big_cqe, GFP_NOWAIT);
 	return io_cqring_add_overflow(ctx, ocqe);
 }
Until next time 👋