Tracking down a bug in the Linux kernel
About two months ago, I stumbled upon a critical issue allowing a process to allocate kernel memory exceeding the process's resource limits, potentially opening the door for Denial of Service attacks. This post summarize my journey from finding the bug to submitting a patch to the Linux kernel.
A little introduction
In October 2025, I started building a
toy event loop library to play with
io_uring.
For those unfamiliar with io_uring, it is a modern Linux API for asynchronous
input/output. Unlike traditional methods, it leverages
ring buffers for efficient
communication between user and kernel space. Here’s a brief overview diagram:


And for code aficionado, here's an imperative pseudo-code:
# Create an io_uring file descriptor.
ring = io_uring_setup()

# Add an entries to submission queue (SQ)
sqe = io_uring_get_sqe(ring)
io_uring_prepare_timeout(sqe, 2 * ns_per_sec)
sqe = io_uring_get_sqe(ring)
io_uring_prepare_timeout(sqe, 1 * ns_per_sec)

# Submit 2 entries from submission queue and wait for 1 operation to complete.
io_uring_enter(ring, 2, 1)

# Read entry from completion queue (CQ)
cqe = io_uring_get_cqe()

# Process completion...
Once you've setup io_uring, a single system call is used to submit works and
wait for completions. I/O heavy programs tends to perform better with io_uring
because they
makes way less system calls
and less data is copied between kernel and user space.
That being said, io_uring, being released in 2019, is not as battle tested as
other Linux system calls. In June 2023, Google's security team reported that 60%
of the exploits submitted to their bug bounty program in 2022 were exploits of
io_uring vulnerabilities. This is why Android, ChromeOS as well as Google
servers disable it by default.
The issue
io_uring uses 2 ring buffers that serves as fixed size queue, one for
submission (SQ) and one for completion (CQ).
As always when working with queues, you must consider what happens when the consumer is slower than the producer. What happens if a program keep adding entries to the submission queue faster than the kernel reads them? What happens if the kernel produces completions faster than the program consume them?
Let's answer those questions.
First, you can't produce faster than the kernel consumes, this is by design. If the SQ is full, you won't be able to get a new SQE without submitting first. Submission is done via a system call that doesn't return until the kernel starts work for each submitted entry.
However, there is no limit on the total number of active submitted entries, as long as you perform multiple submissions. This makes it possible for a (bad) program to keep pushing I/O work on the kernel when completion queue is full. What happens when kernel completes an I/O operation and the completion queue is full?
I couldn't find the answer in the man pages so I built a small C program to do so:
int submit_loop(struct io_uring *ring, long entries) {
  struct io_uring_sqe *sqe;
  int err, s;

  // Submit tasks in loop.
  for (;;) {
    sqe = io_uring_get_sqe(ring);

    // Submission queue is full, submit it.
    if (sqe == NULL || entries <= 0) {
      s = io_uring_submit(ring);
      if (err != 0) {
        return -err;
      }

      if (s >= entries || entries <= 0)
        break;

      entries -= s;

      continue;
    }

    // Prepare a no-op operation that will completes immediately.
    io_uring_prep_nop(sqe);
  }

  return 0;
}
If you run ./kmemleak 1000000000 and observe memory usage in htop, you will
see that total memory usage increase (the Mem[||||] bar in the top section)
while process memory usage stays at 0.0%.
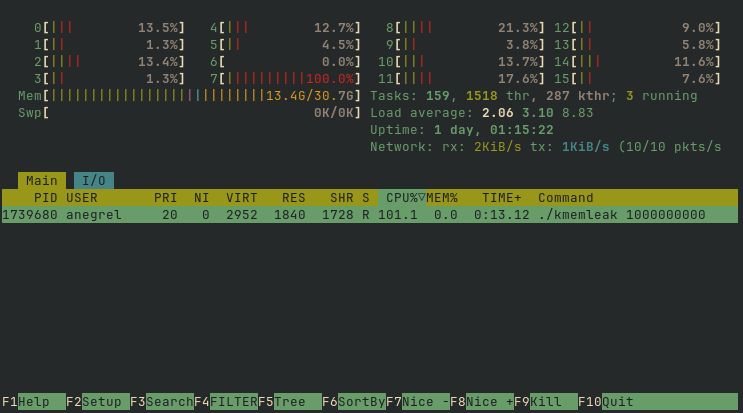
It looks like memory is allocated on the kernel side and the process isn't
accounted for it, at least htop doesn't report it. If that's really the case,
this is bad and could be used to perform Denial Of Service. If the kernel
doesn't track kernel memory associated to a process, one could allocate tons of
kernel memory, triggers the Out-of-Memory killer so it kills another, more user
space memory hungry, process.
We can verify this by running kmemleak in a control group with a memory
controller and a defined maximum memory usage limit. Control groups are a kernel
mechanism that underpins containers. You can attach controllers to a control
group to monitor various types of system resources, such as memory, CPU,
threads, and more.
Since version 211, systemd-run can spawn a process in a control group. Let's
run kmemleak and limits memory usage to 1GiB:
$ systemd-run --scope --user -p MemoryMax=10M ./kmemleak 1000000
Again, if you observe memory usage you will see that memory grows beyond the
limit. If you try the same using memleak, a program that allocates user space
memory, the process is instantly killed as soon as it tries to exceed the limit.
So it really looks like there is a problem here...
Before jumping on conclusion, let's check memory usage reported by the memory controller.
Control groups expose configuration, metrics, and more as files of the cgroup2
filesystem. Here is set of commands to print peak memory usage:
$ PID="$(ps a -o pid,command | awk ' /kmemleak/ { print $1; exit }')"
$ cat "/sys/fs/cgroup/$(cat /proc/$PID/cgroup | awk -v FS=: '{ print $3 }')/memory.peak"
41799680
According to cgroup-v2
documentation, value in memory.peak correspond to:
The max memory usage (in bytes) recorded for the cgroup and its descendants since the creation of the cgroup.
This is roughly 40MiB of memory, way beyond the 10MiB limit.
We are now 100% sure that there is a problem here. Kernel memory is tracked, but for whatever reason the process isn't killed. Let's track that motherfucking bug 🦟.
The bug
Before spending time on tracking the bug and fixing it, it's always wise to check no one else is doing the same.
After a quick search, I've found this issue in the
liburing repository:
io_uring can use unlimited memory, DoS the system: no backpressure
on non-completing operations #293
It's marked as resolved with the following conclusion:
it's now restricted by a memory cgroup
https://git.kernel.dk/cgit/linux-block/commit/?h=for-5.14/io_uring&id=91f245d5d5de0802428a478802ec051f7de2f5d6
My kernel is more recent than this issue, so it's different. Still, this confirm that kernel memory is accounted.
I've found nothing on bugzilla, so... Let the track begin!
But where do we start? The kernel is literally millions of lines of code,
the memory subsystem is more than 100 thousand lines of code and io_uringis
around 20 thousand lines of code.
We have to narrow down our search. We must trace the kernel.
The Linux kernel comes with various tracing mechanisms that can be used for debugging.
One of them is Kernel Probes or Kprobes that enables you to dynamically break into any kernel routine and collect debugging and performance information non-disruptively.
Kprobes requires building and loading a kernel module that will register a group of probes. It looks like a lot of work for something we will throw in the trash as soon as we're done. If only there was an easy way to trace the kernel without building a kernel module...
>
eBPFenters the chat.
Extended Berkeley Packet Filter or eBPF is Linux technology that can run
sandboxed programs within the kernel itself. It is used to safely and
efficiently extend the capabilities of the kernel without requiring to change
kernel source code or load kernel modules.
However, to use eBPF you must write a program, compile it to eBPF bytecode
and loads it into the kernel. If only there was an easy way to create and load
an eBPF program...
>
bpftraceenters the chat.
bpftrace is a high-level tracing language for Linux that provides a quick
and easy way to write eBPF programs. It is exactly what we need.
bpftrace takes inspiration from awk and is ideal for short, single use
programs.
Now, let's search for a Kprobe that we can use. We can list available Kprobes:
$ sudo bpftrace -l 'kprobe:*' | wc -l
79187
Hmm, that's a lot. Maybe we can list for probes with the infix mem:
$ sudo bpftrace -l 'kprobe:*mem*' | wc -l
1523
That's better. After a quick skim, it seems we are only interested in probes
with the memcg infix. memcg stands for memory control group.
$ sudo bpftrace -l 'kprobe:*memcg*' | wc -l
59
Perfect! Let's trace all those kernel probes and count their invocations.
$ sudo bpftrace \
    -e 'kprobe:*memcg* { printf("%s\n", probe); }'\
    -p $PID \
  | sort | uniq -c
      35 kprobe:flush_memcg_stats_dwork
     163 kprobe:__get_obj_cgroup_from_memcg
     186 kprobe:memcg_charge_kernel_stack
    1033 kprobe:memcg_page_state
    1450 kprobe:__memcg_kmem_uncharge_page
    3006 kprobe:memcg_list_lru_alloc
    4248 kprobe:__memcg_kmem_charge_page
   38475 kprobe:count_memcg_events
  104512 kprobe:charge_memcg
  135263 kprobe:mod_memcg_state
  154792 kprobe:try_charge_memcg
  531742 kprobe:mod_memcg_lruvec_state
 6028668 kprobe:__memcg_slab_post_alloc_hook
25649294 kprobe:__memcg_slab_free_hook
Only these 14 probes are triggered by kmemleak. Nothing conclusive here, let's
print kernel stack trace:
$ sudo bpftrace -e 'kprobe:*memcg* { printf("%s\n", kstack()); }' -p $PID
        __memcg_slab_post_alloc_hook+5
        __kmalloc_noprof+1153
        io_alloc_ocqe+111
        __io_submit_flush_completions.cold+61
        io_submit_sqes+555
        __do_sys_io_uring_enter+597
        do_syscall_64+183
        entry_SYSCALL_64_after_hwframe+119
...
Much better! We can see all functions called from the io_uring_enter system
call up to an allocation of kernel memory: kmalloc.
It appears that an o?????????? completion queue entry (OCQE) is allocated by
io_alloc_ocqe. The manual discusses CQE but there is no mention of OCQE.
At this point, I feel like we have sufficiently narrowed our search. It's time to read kernel code 😃.
$ git clone https://github.com/torvalds/linux
$ git checkout v6.16 # my kernel version
$ grep -Rn 'io_alloc_ocqe' io_uring/
io_uring.c:747:static struct io_overflow_cqe *io_alloc_ocqe(struct io_ring_ctx *ctx,
io_uring.c:888:	ocqe = io_alloc_ocqe(ctx, cqe, big_cqe, GFP_KERNEL);
io_uring.c:900:	ocqe = io_alloc_ocqe(ctx, cqe, big_cqe, GFP_ATOMIC);
💡 Oooh ! an overflowing completion queue entry (OCQE) is allocated each time an operation completes and the CQ is full.
By looking at the bpftrace output for our process, all kernel allocations are
done by io_alloc_ocqe. However, we don't know which call, the one with
GFP_KERNEL or GFP_ATOMIC, is allocating the memory.
Memory allocation in the kernel is well documented. GFP acronym stands for "get free pages", the underlying memory allocation function. GFP flags exists to express how some memory should be allocated.
For example, kzalloc, a function to allocate zeroed memory, is defined as
follow:
static inline void *kzalloc(size_t size, gfp_t gfp)
{
        return kmalloc(size, gfp | __GFP_ZERO);
}
It simply sets the
__GFP_ZERO bit flag.
Common set of GFP flags are defined as GFP_XXX values while bit flags are
defined as __GFP_XXX:
GFP_KERNEL, a general purpose flag used for kernel-internal allocations, is defined as:__GFP_RECLAIM | __GFP_IO | __GFP_FS.GFP_ATOMIC, a flag used for allocations that can not sleep and need to succeed, is defined as__GFP_HIGH | __GFP_KSWAPD_RECLAIM
Allocations that should be accounted by the memory controller must have the
__GFP_ACCOUNT bit set. At first, I thought that's the solution but the
io_alloc_ocqe function always sets this bit when calling kzalloc:
static struct io_overflow_cqe *io_alloc_ocqe(struct io_ring_ctx *ctx,
					     struct io_cqe *cqe,
					     struct io_big_cqe *big_cqe, gfp_t gfp)
{
    // ...
	ocqe = kzalloc(ocq_size, gfp | __GFP_ACCOUNT);
    // ...
}
So, why the process isn't killed? When does the OOM killer is triggered?
From kernel.org:
It is possible that on a loaded machine memory will be exhausted and the kernel will be unable to reclaim enough memory to continue to operate. In order to save the rest of the system, it invokes the OOM killer.
It seems to be event based. When the kernel needs more memory and can't reclaim it via swap or else, it invokes the OOM killer.
So, logically, this is done by the memory allocator: kmalloc. That way, when
memory allocation is requested, it can triggers the OOM killer to free some
memory instead of returning NULL.
Same goes for memory accounting in control groups. As soon, as it reach its limit, process get killed.
If we look at stack traces of other Kprobes, notably try_charge_memcg, we can
confirm our hypothesis:
try_charge_memcg+1
obj_cgroup_charge_account+209
__memcg_slab_post_alloc_hook+259
__kmalloc_noprof+1153
io_alloc_ocqe+111
__io_submit_flush_completions.cold+61
io_submit_sqes+555
__do_sys_io_uring_enter+597
do_syscall_64+183
entry_SYSCALL_64_after_hwframe+119
After allocating memory, obj_cgroup_charge_account is called to update control
group's statistics, and, trigger the OOM killer if needed.
try_charge_memcg is pretty complex, it is 194 lines long. I won't go into the
details as I don't understand everything but you can read it
here
if you're curious.
As expected, it can trigger the OOM killer.